Quick commerce · Tamil Nadu
Hosur Quick Commerce Report
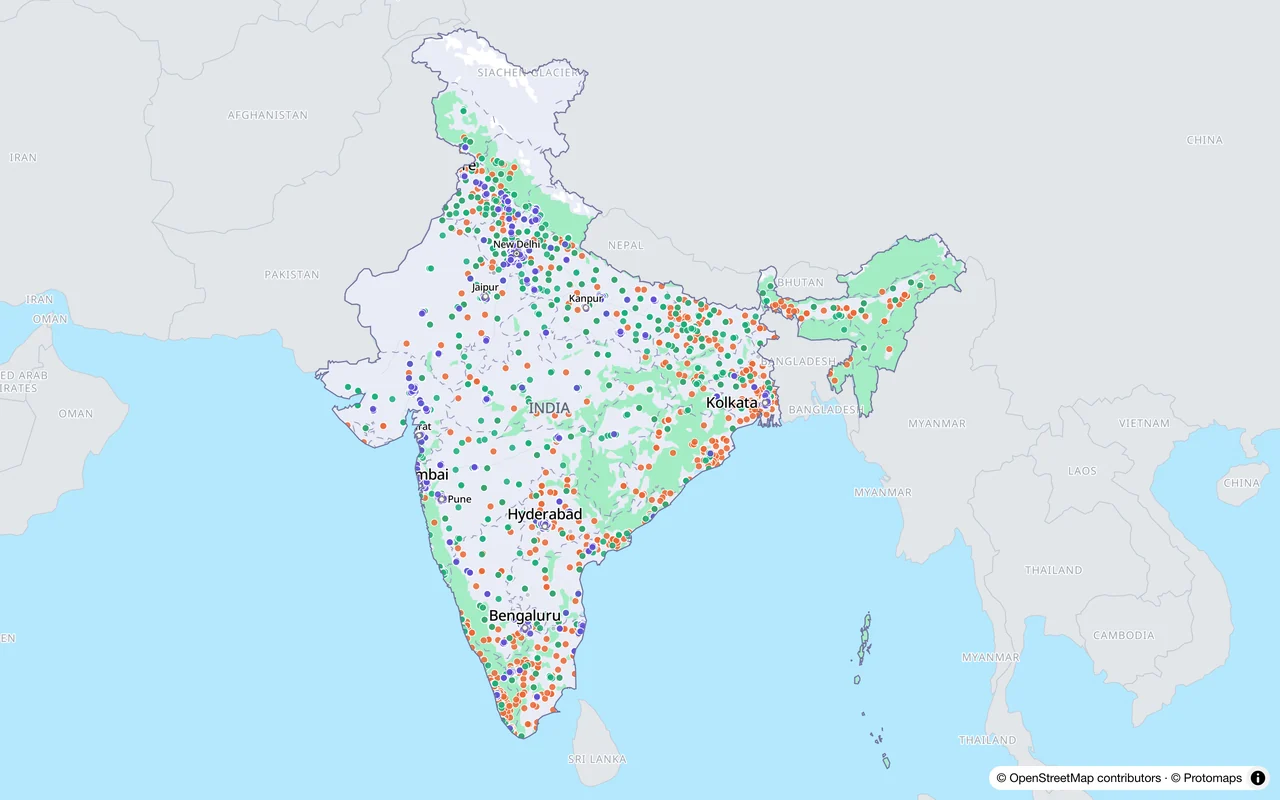
Every quick-commerce dark store in Hosur, mapped, grouped by area and turned into city-level research. Hosur is the industrial city in Krishnagiri district, northern Tamil Nadu; here's how quick commerce has built out across it.
4
dark stores
2
areas covered
4
platforms present
2,00,000
population
Counts from our early October 2026 read.
The sample is Store Atlas's own Excel file: a sheet for each app, free, no email. Or see Hosur on the free map.
Hosur Quick Commerce Report
Platform mix in Hosur
How the 4 dark stores split across the platforms, in our early October 2026 read.
1
25% share
1
25% share
1
25% share
1
25% share
What stands out in Hosur
From our July 2026 report.
Swiggy Instamart has zero presence in Hosur, despite operating in 92% of peer cities
94 of 102 comparable cities have Swiggy Instamart stores. Hosur is a white space.
Top areas by dark-store density
The busiest 2 of 2 areas, in our early October 2026 read. Store Atlas has every one, with each app's count and every store we hold in it.
| Area | Stores | Platforms |
|---|---|---|
| Shanthi Nagar West | 3 | |
| Anthivadi | 1 |
Hosur in context
Population
2,00,000
Key sectors
Automobile and two-wheeler manufacturing · Auto-component and general engineering · Precision and watch manufacturing
Compare with nearby & similar markets
Tiruppur
5 dark stores
Tiruppur is led by Swiggy Instamart vs Blinkit in Hosur
Kurukshetra
6 dark stores
Store density 29.3 vs 15.0 per million population
Badlapur
6 dark stores
Store density 25.5 vs 15.0 per million population
Anand
5 dark stores
Similar profile - 5 stores across Gujarat
Or see the full research catalogue across all cities.
Store Atlas
See every store we hold in Hosur, one by one
Store Atlas gives you each store's position and how exact it is, its address and pincode where we hold them, its opening hours where the app shows them, and its product counts, for Blinkit, Zepto, Swiggy Instamart, Flipkart Minutes and Amazon Now and the rest, on one map and in one Excel file. Every week it shows which stores are new, closed or moved, and its Week by week view counts each app's stores by city, state and area, in Excel.
This page shows our early October 2026 read. Store Atlas is read every week, so it has this week's stores.
Or open the sample as a PDF, easier to read on a phone.