QCM Research · Maharashtra
Mumbai Quick Commerce Report
A 35-page report on every quick-commerce dark store in Mumbai - mapped, grouped by area, and turned into city-level research. Mumbai is the financial capital and entertainment hub; here's how quick commerce has built out across it.
278
dark stores
100
areas covered
5
platforms present
2,16,00,000
population
Data window: July 2026 · instant access · one-time ₹99 or ₹299/yr for every city (limited-time, was ₹499).
 35 pages
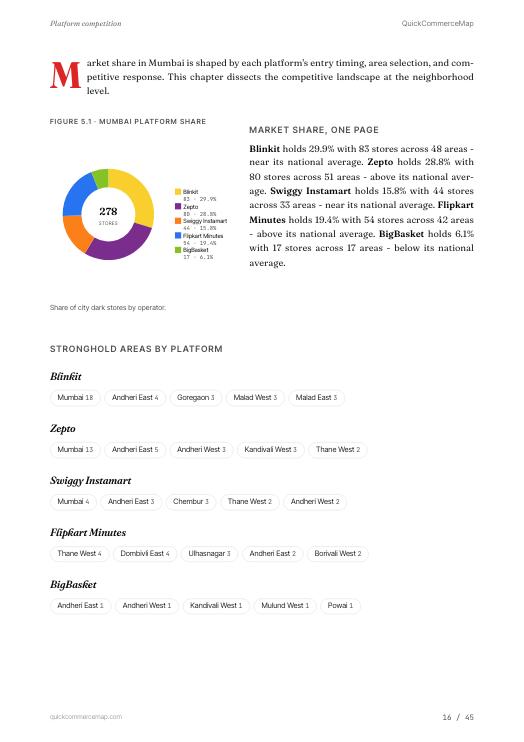
 Platform mix in Mumbai
How the 278 dark stores split across the platforms.
83
29.9% share
80
28.8% share
44
15.8% share
54
19.4% share
17
6.1% share
What stands out in Mumbai
BigBasket's market share in Mumbai (6%) is significantly lower than in peer cities (avg 13%)
BigBasket operates 17 of 278 stores. National share is 12%, making Mumbai a weak market for the platform.
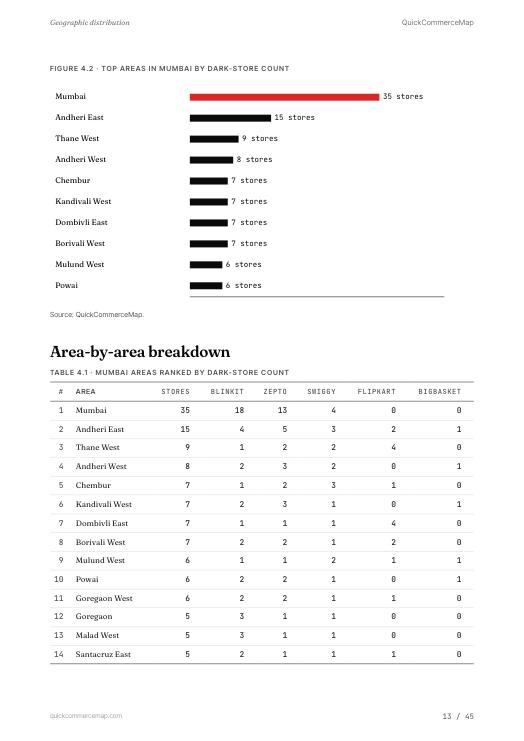
Top areas by dark-store density
The busiest 8 of 100 areas. The full report has every one, with the platform present in each.
| Area | Stores | Platforms |
|---|---|---|
| Mumbai | 35 | |
| Andheri East | 15 | |
| Thane West | 9 | |
| Andheri West | 8 | |
| Chembur | 7 | |
| Kandivali West | 7 | |
| Dombivli East | 7 | |
| Borivali West | 7 |
What the full Mumbai report looks like
These are actual pages from the 35-page Mumbai PDF. Buying it in the research portal also unlocks the live dashboard — the same data, interactive.
Inside the report
- Area-by-area density analysis
- Platform-by-platform store breakdown
- Coverage gaps & underserved areas
- Growth trends & expansion patterns
- Interactive store-density map
- Demographics & economics context
City-specific, not boilerplate
51 areas in Mumbai have exactly one platform to choose from — the report names each one.
An estimated 3,300–5,515 quick-commerce workers in Mumbai, with salary bands by role.
Download the free Mumbai sample PDF (4–6 pages)Judge the free Patna sample first. If your access isn't active within 1 working day of payment, we refund in full — trust@quickcommercemap.com.
Mumbai in context
Population
2,16,00,000
NSDP per capita
₹2,98,000
Key sectors
Financial services · IT/ITES · Entertainment & media
Get the full Mumbai report
The complete report opens in the research portal — interactive, always up to date. One city is ₹99; every city is ₹299/year (limited-time, was ₹499).
Area-by-area density analysis
Platform-by-platform store breakdown
Coverage gaps & underserved areas
Growth trends & expansion patterns
Interactive store-density map
Demographics & economics context
Pilot pricing: All-Access is normally ₹499/year. We're trialing ₹299 for a short 7-day window to see if a lower price reaches more people — members who joined at ₹499 keep full access.
Single city
₹99 one-time
One full city report — yours permanently.
- Full report for any one city
- Density map + area tables
- Coverage & platform analysis
All-Access
₹299 ₹499 per year
Every city, one subscription. Five cities' worth — you get 408.
- All 408 city reports
- Data refreshes included
- City PDF reports where available
Pro
₹2,999 per year
For analysts who need the raw data.
- Everything in All-Access
- CSV + Excel exports
- Compare up to 5 cities side by side
Prices inclusive of GST · automatic tax invoice · UPI, card or netbanking · access within seconds.
Compare with nearby & similar markets
Pune
244 dark stores
34 fewer stores despite similar demographics
Thane
55 dark stores
223 fewer stores despite similar demographics
Delhi
474 dark stores
196 more stores despite similar demographics
Kolkata
220 dark stores
58 fewer stores despite similar demographics
Hyderabad
406 dark stores
Hyderabad is led by Zepto vs Blinkit in Mumbai
Or see the full research catalogue across all cities.
The full Mumbai dark-store data, in seconds
Every store, every area, platform by platform. Start with Mumbai for ₹99, or unlock all cities for ₹299/year.